
Tracking Heart Rate Variability: A Mini Case Study
Click here to receive insights in our weekly newsletter.
In recent years, technology has advanced to the point where we can measure stress on the spot using a wearable device, such as the Apple watch, or through an app that uses the phone camera. By simply measuring your heart rate for a minute, you’ll get a stress score through something called Heart Rate Variability (HRV).

Here is a short summary of what HRV is all about:
While your heart rate measures the number of beats per minute, HRV measures the fluctuations in time between beats. Your heart isn’t a metronome and while you might not feel it, there are slight variations in the time between beats (shown in the image below). This is called HRV and is measured in milliseconds.

When there is a higher variation between heart beats, there is a good balance between the sympathetic (“flight or fight”) and parasympathetic (“rest and digest”) nervous systems, and is indicative of low stress. When there is a lower variation between heart beats, this is indicative of lower activation of the parasympathetic nervous system and high stress. For more details on the science behind HRV, check out our blog on this topic.
Measuring your HRV is an easy way to spot check how stressed you are on a daily basis. However, there is a lot of interindividual variability so it’s important not to worry too much about the absolute numbers. Instead, pay attention to how your values change depending on how much sleep you had the night before, your physical activity level that day, or even your psychological stress. Day-to-day fluctuations are normal, however if there is a downward trend over time, this might be an indication that you are under chronic stress, are run down, or are fighting a cold or illness. Pay attention to these trends and make sure you prioritize recovery if this is the case!
Below is a practical example of how HRV can be used to track stress and recovery.
Case Study: 2-Week HRV Tracking
One of our VIIVIO users (a 32-year-old female) tracked her HRV for two weeks. As HRV fluctuates throughout the day, she measured her HRV at the same time every day - as soon as she woke up while still lying in bed. She also tracked her sleep, physical activity, psychological stress, and other lifestyle factors over the course of the two weeks. Here is what we found:
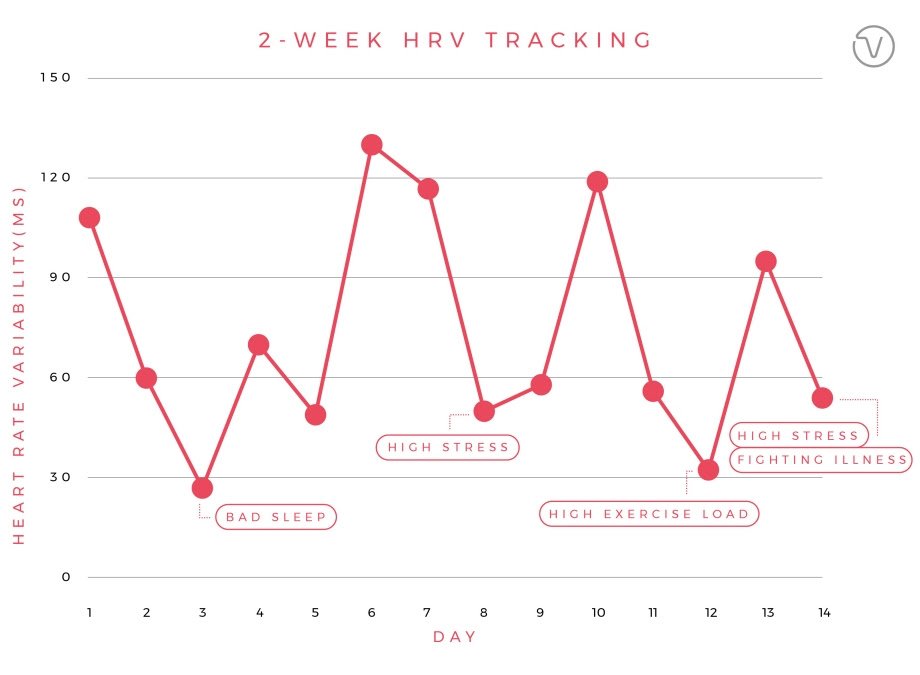
Minimum HRV: 27ms
Maximum HRV: 130ms
Average HRV: 73ms
There were significant day-to-day fluctuations, however there wasn’t an overall upward or downward trend over the two weeks. Some of the lower HRV values were associated with physical and/or mental stressors. These are highlighted below:
Day 3 (HRV 27ms): The user indicated that she slept for 6 hours, compared to her usual 7.5 hours. Sleep is when the nervous system recovers, so this could be one reason for the low HRV value on this day.
Day 8 (HRV 50ms): The user had a high subjective stress rating this day. As HRV is an indication of both physiological and psychological stress, this might explain the lower HRV value.
Day 12 (HRV 32ms): The user recorded 6 hours of exercise the day before. This low HRV value is expected as exercise is stressful on the body. However, with proper rest and recovery, HRV values should jump back up in a day or two.
Day 14 (54 ms): The user had a high subjective stress rating this day and she also indicated that she was on the verge of getting sick. A low HRV can be indicative of the body fighting off an illness so recovery was particularly important that day.
As you can see, various factors might have contributed to the fluctuations in HRV over the course of the two weeks. While there were a few days she had a lower HRV, this wasn’t a reason for concern as there wasn’t a downward trend (a sign of chronic stress, illness, or under recovery). Keep in mind that two weeks is a good starting point but tracking your HRV for a longer period of time will give you a more accurate representation of your baseline. From there it will be easier to flag days that are out of the ordinary.
What are we finding in the research?
Last year, Dr. Marco Altini, a leading scientist in HRV, published a study that looked at the various factors that affect resting heart rate (HR) and HRV in the general population. 28,175 people recorded their HR and HRV periodically over 5 years. Dr. Altini and his team then looked at the relationship between HR and HRV and individual characteristics (such as age and sex), as well as acute stressors (alcohol intake, sickness, etc.) over that time period.
The researchers discovered that HR and HRV were associated with certain individual characteristics (e.g. age and physical activity level), but that there were also associations between acute stressors and HR and HRV. For example, periods of high training, sickness, alcohol intake, and the luteal phase of the menstrual cycle were associated with higher resting HR and lower HRV.
Dr. Altini and his team suggest that measuring HR and HRV on a regular basis can help people keep track of their normal values and serve as an early warning sign. A higher resting HR or lower HRV compared to normal might indicate to the person that their body is under stress before they would otherwise become aware of it.
Read the full article here.

Figure from Altini and Plews, 2021. Among other findings, the researchers discovered that participants measured a higher resting HR and lower HRV when they were sick compared to when they were healthy.